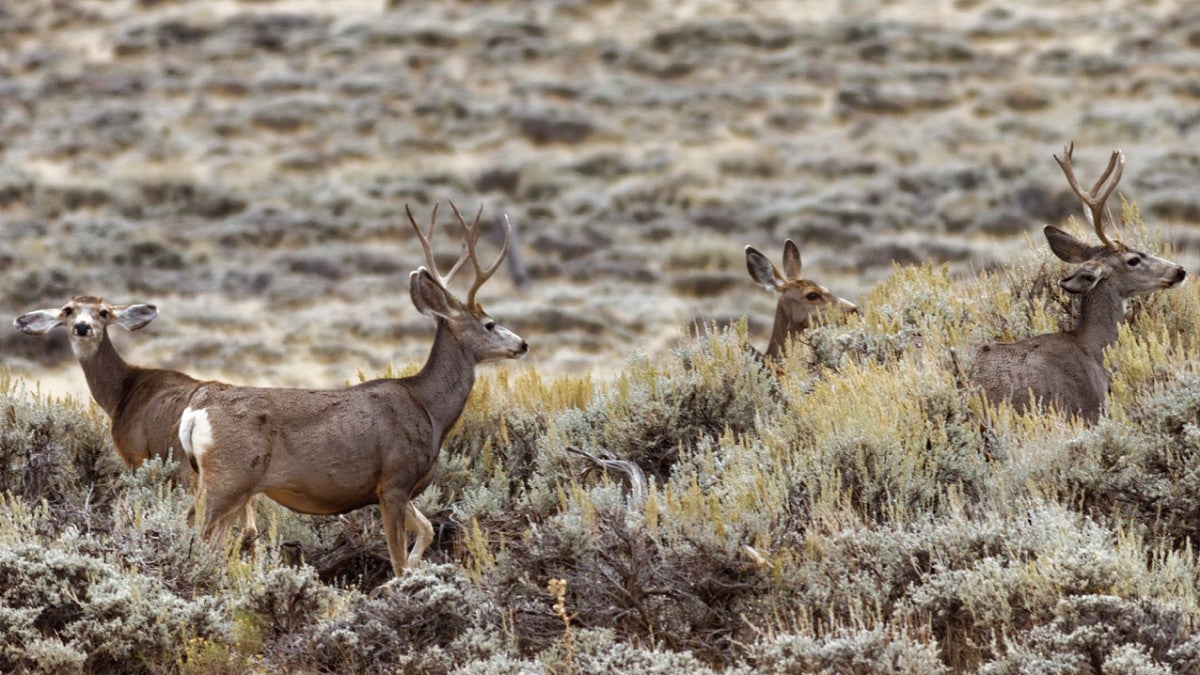
In autumn, the Red Desert mule deer begins its over 100-mile journey from eastern Idaho to southern Wyoming to escape the heavy winter snow. The treacherous voyage forces them over the sprawling plains of the Mountain West and through narrow corridors, such as the Fremont Lake Bottleneck, which requires the deer to either swim or navigate through residential areas to pass.
Throughout this journey, the deer will cross countless barriers. Highways, fences and railroads block the migration patterns, resulting in 30% of mule deer deaths being a result of highway collisions or fence entanglements, according to a Journal of Wildlife Management study.
The cartographic team at the University of Oregon’s InfoGraphics Lab, along with an outside team of wildlife ecologists and spatial analysts have developed an interactive atlas to track vast migrations of ungulates, which are hoofed, typically herbivore mammals.
Released in March, the atlas provides a deep dive into around 250 distinct migrating herds, providing biologists and policy makers with a standardized version of migration patterns.
Big game, including deer, elk, moose and bison, have the largest migratory patterns after birds, according to U.S. Geological Survey.
Why Standardized Tracking Data Matters
Since 2018, wildlife researchers from different states have shared data with each other. A year later, the coalition grew to include biologists, cartographers, and policy makers sharing data on migration patterns.
A rare collaboration crossing state borders, the annual printed report, titled "Ungulate Migrations of the Western United States," is now in its seventh volume, led by Alethea Steingisser and Peyton Carl in the InfoGraphics Lab. The interactive atlas takes all the mapped migrations from the years of reports and makes them accessible a single website.
The report is focuses on six different ungulate species with dozens of herds and the routes they take each year. From Yellowstone bison to pronghorn, elk, and mule deer, the project meticulously follows their seasonal movement. Ungulates typically migrate seasonally to seek out fresh food sources. As snow melts, these ungulate species follow the “green wave” of emerging plants, feeding on vegetation until snow cover returns.
To gather data on the ungulates, field ecologists ride helicopters over large herds of big game. They launch nets down from the chopper to capture animals, ensuring the animals won’t be harmed. Attaching a tracking device to their necks, they release the animal to rejoin the herd.
The tracking device will provide data for the scientists for years to come. After initial processing that data is shared with the InfoGraphics Lab, including Erik Steiner, Joanna Merson, Clare Otcasek, Alethea Steingisser, and student collaborators, to translate the tracking data into a comprehensive website.
Most people encounter maps as paper objects or an image on a computer. But Steiner, director of the InfoGraphics Lab, explains that they wanted this work to move beyond static maps and annual reports. The idea for an interactive website, in which data from the reports is continuously added, arose.
“All of our data is really driven by the work of biologists across 11 states, coordinated to try to develop a fairly standardized approach that allows it to be uniformly interpretable,” Steiner said. “Mapping the best available data in a consistent and legible way helps focus conservation efforts, especially where they intersect with infrastructure and development pressures.”
Influence on Policy and Conservation
The atlas includes both general information about each herd and its migratory behavior including, corridors, migration timing, duration, and distance. By using Geographic Information Systems (GIS), the data is made easily accessible and downloadable, so policy makers can use it to protect wildlife.
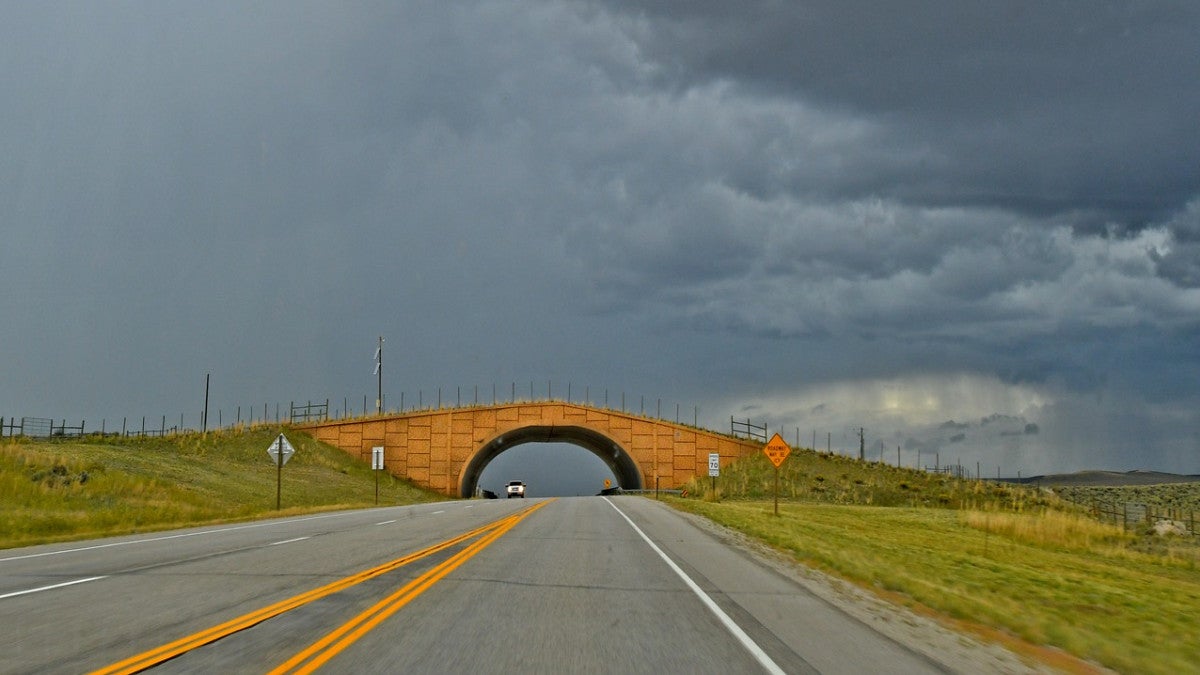
One outcome from the atlas has supported protecting the Red Desert mule deer. Its long migration takes the deer across roads and through residential areas. In response, the state of Wyoming created a “designated corridor,” an area shaped by common migration patterns of the deer. Building large infrastructure in these areas is prohibited, allowing animals to move safely between larger, separated natural areas.
Most atlases are a fixed representation, such as a map that illustrates territories that represent the time when it was created. The InfoGraphics Lab’s “Migration Viewer” is crucial for understanding migratory patterns.
The Western Migrations Atlas is designed for a broad audience including researchers, policy makers, hunters and the general public to explore it.
“Most people think of cartography as a communication process,” Steiner said. “But what’s always driven me is thinking about cartography as a discovery process.”
Students at the Center of the Project
Behind the aesthetically appealing website are students like Owen Ferguson, who have helped develop the atlas. Ferguson isn’t just assisting; he’s a pillar of the project.
“He’s one of the best developers we’ve ever had,” said Steiner, “He's just been such a great employee. He's super diligent, always super responsive and totally engaged. He's always exceeding expectations.”
Originally a data science major, Ferguson started at the InfoGraphics Lab a year ago. He expected to get involved with mostly data but was surprised when he was integrated into some of the design elements.
“When I applied, I didn’t even really know that I was going to be doing this, but I kind of got a mix of both and started doing web development,” he said.
Since then, Ferguson has had to adapt, learn a new coding language and develop some crucial professional skills. After being exposed to these new skills, his interests shifted.
Ferguson now sees himself staying in web development. For him, it allows him to mix his creativity with coding. “I’ve always really loved geography, and I’ve always been a big fan of technology,” he said. “Combining that has kind of been the perfect goal.”
His most recent task was creating a mobile version of the website. Since the atlas has layers upon layers of information, condensing all that data onto a mobile screen has been a challenge. Ferguson took the project head-on. His design was widely praised and instantly incorporated.
“I kind of just had some of these ideas spur of the moment, and they ended up working well,” he said. “Everyone kind of universally agreed it was pretty good so I obviously can’t complain.”
Ferguson’s involvement in this project shows that some student involvement stretches beyond a student job — it’s impactful, hands-on experience that is contributing to a project that will be used by researchers and policy makers across the western United States for years to come.
The Infographics Lab has been a launchpad for many students to land highly prestigious positions at organizations such as National Geographic, Apple and The New York Times, said Joanna Merson, lead web developer on this project.
“Including students on projects doesn’t just benefit the students, it also strengthens the projects. With creative and capable students like Owen, we often simply point them in a direction, provide a framework for a goal, and they produce an innovative solution or beautiful, functional design,” she said.
“One hundred percent. This has made my career ready,” said Ferguson. "This job in the lab is actually getting me a pretty real insight into how web development works and how to collaborate with a team.”
Even after its initial release, the work is far from over. Steiner hopes that this Atlas will serve as a central, standardized system that data can continually be added to. The team is already working on the maps for Volume 7 from the annual reports and anticipate more releases of the site over the course of the next year. New migration data could help protect wildlife while migrating across roads, rivers and state borders.
— By Leo Brown, College of Arts and Sciences